


|
|
||
|
Control flow is the aspect of program design that describes how execution proceeds through the operation body. Conditional statements and loops disturb the otherwise sequential execution and create additional paths in the execution graph. Such graphs can be reported and displayed for user inspection and are also used as a way to highlight troublesome code fragments when various errors are found.
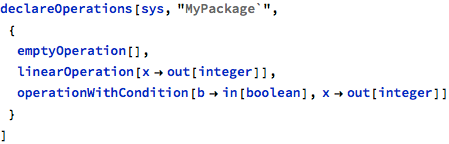
The following simple examples show control flow diagrams for operations with various internal structures.
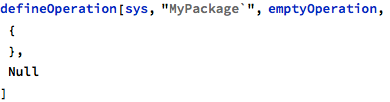
The control flow diagram for an empty operation is a simple graph with just one edge:


The “start” and “finish” nodes in this graph are virtual and represent the entry and exit points from the operation.
The same diagram can be obtained also in the raw form - in this case a flat list of DirectedEdges, which is suitable for algorithmic processing:

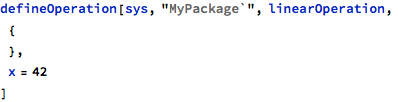
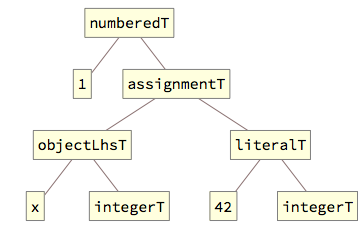
Simple operations with a single statement will have one more node on the path from “start” to “finish”, representing that statement:


The additional node (in general, there will be one node for each statement in the operation body) is labeled with a statement number followed by a short prefix describing it - that number is part of the grammar and as such can be used to associate elements from different presentation forms:

The raw form of the same control flow report will also have just two edges:


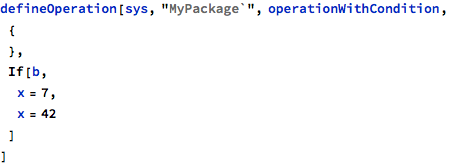
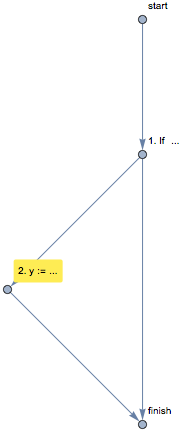
Finally, operations that contain control statement in their bodies will have more elaborate (but always acyclic) diagrams, as control statements introduce alternative paths in the execution flow:

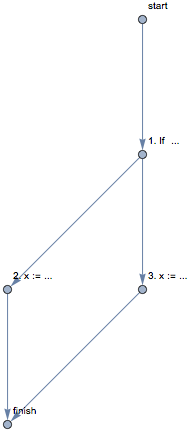
The nodes numbered 2. and 3. are single statements from both branches of the If statement (which itself has number 1.) - their shortened labels, on their own, might not be sufficient to match them to the original model, but knowing that statements are numbered sequentially and in a depth-first manner, it can be concluded that statement 2. belongs to the “then” branch and statement 3. belong to the “else” branch.
The raw-format report contains the same information in the list form:


Control flow diagrams are mostly useful when they are automatically generated with annotations for highlighting troublesome statements. For example, the following operation has a frequent coding error:
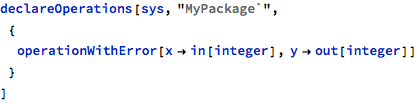
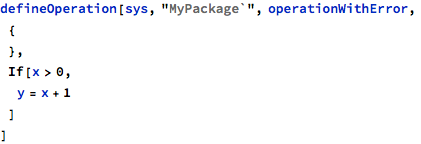
There is possible integer overrun error at the addition expression, which can be found with proof checks (described in detail in another chapter):

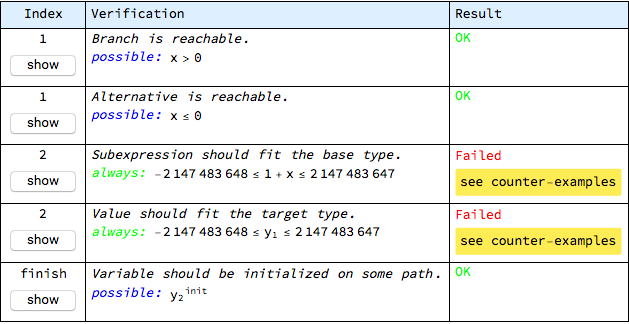
The table above presents results of proof checks for this operation. The first column of this table contains statement numbers with “show” buttons - these buttons display control flow diagrams with highlighted respective statements. For example, pressing the third or fourth button (with statement number 2., where the errors are found) displays, in a separate window, the following diagram:
Such a diagram is also a control flow diagram, but with additional highlighting that allows to identify the exact place in the model where the error occurs.
Even though control flow diagrams are usually displayed to report errors, they can be prepared only for those operations that, as the minimum requirement, have correct grammar.
Previous: Flow checks, next: Call graph checks and analysis
See also Table of Contents.