


|
|
||
|
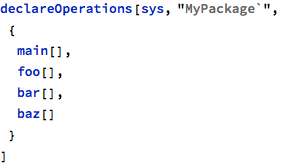
FMT supports straightforward ways to analyze and verify graphs of calls between multiple operations. The following set of operations can be used to demonstrate these facilities:
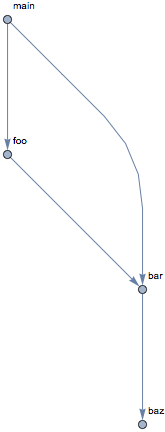
The main operation (presumably the entry point for the whole program) directly calls foo and bar:
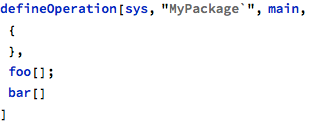
Operation foo uses bar services:

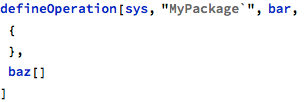
And finally, bar refers to baz:
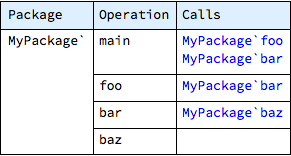
The whole call graph for this system can be displayed with the showCallTable command:

It is also possible to prepare more selective reports, with the use of conventional optional parameters packageNames and operationNames, for example:

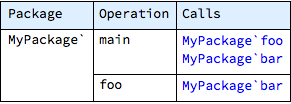
The table above presents all or only the selected operations, grouped by package, and for each entry lists all called operations.
Such a report has its raw version, too, in the form of a nested Association object, where the leaf elements are DirectedEdges showing the call direction from caller to callee:

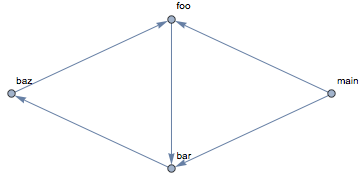
The call information can be also presented as a graph:
The raw-format version of the same information is:

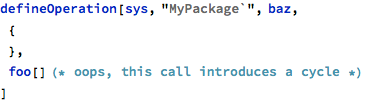
Normally, such a graph is a Direct Acyclic Graph, and in many coding standards that are in use in safety-critical systems it is not allowed to form recursive calls, where the acyclic property would not be preserved. For example, a cycle could be introduced in the implementation of the baz operation:
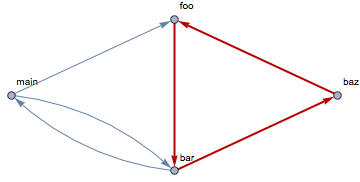
The cycle can be seen in the graph:

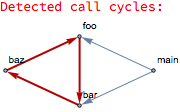
In order to make it easier to analyze cycles in call graphs, a dedicated function can detect and highlight them:

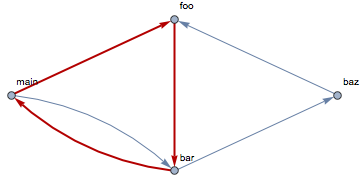
It is also possible for the system to contain multiple call cycles in the analyzed set of operations and the showCallCycles has the capability to detect and highlight them separately. This functionality can be demonstrated with an updated body of bar:
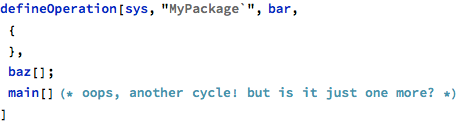
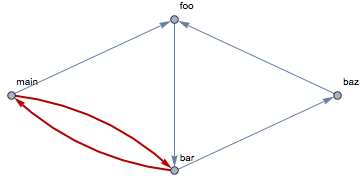
Adding a single operation call might be sufficient to close multiple loops. In this particular case the showCallCycles detects not one, but two more cycles in the call graph:
An important point to consider with such analyzes is that the scope of analysis can be constrained with the selective choice of packages and operations that are taken for report. Such selective reports, where only a subset of operations are involved, can be very useful, because they allow the engineer to focus only on some part of the system, thus increasing the readability of reports in large systems. Still, what can make such constrained reports somewhat deceptive is that the possibility to detect a call cycle depends on the set of operations that are taken for analysis - and some cycles can stay undetected if they happen to span the boundary of the selected subset.
For example, the call graph for just two of the operations (main and foo) can be obtained with the following selective invocation:

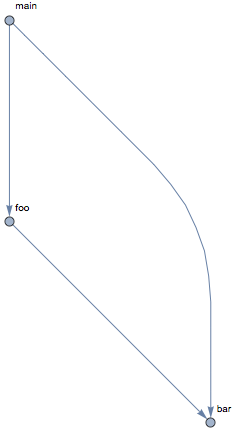
In this graph, the operation bar was included in the result, because it is called from those operations that were picked for analysis - but the bar operation itself was not analyzed, because it was not included in the selected set. This makes the cycles that pass through bar impossible to detect:


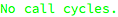
The remaining part of the system looks good, too:

This kind of analysis should be therefore used with care and whole-system analysis should be occasionally performed to detect all possible cycles.
The cycle reporting function has its raw format version as well:
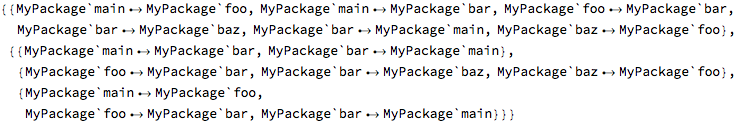
The result seemingly contains a lot of duplication, because it contains both the complete graph and a list of subgraphs, one for each detected cycle.
Previous: Control flow analysis, next: Data aliasing checks
See also Table of Contents.